Alejandra Arevalo
Data analyst and visualization specialist working on Google Trends. Before that, I ran a music data publication and built interactive data visualizations at Hearst Newspapers.

Data Storytelling
I specialize in data journalism, turning numbers into narratives and data visualizations that earn press coverage and travel across content channels.
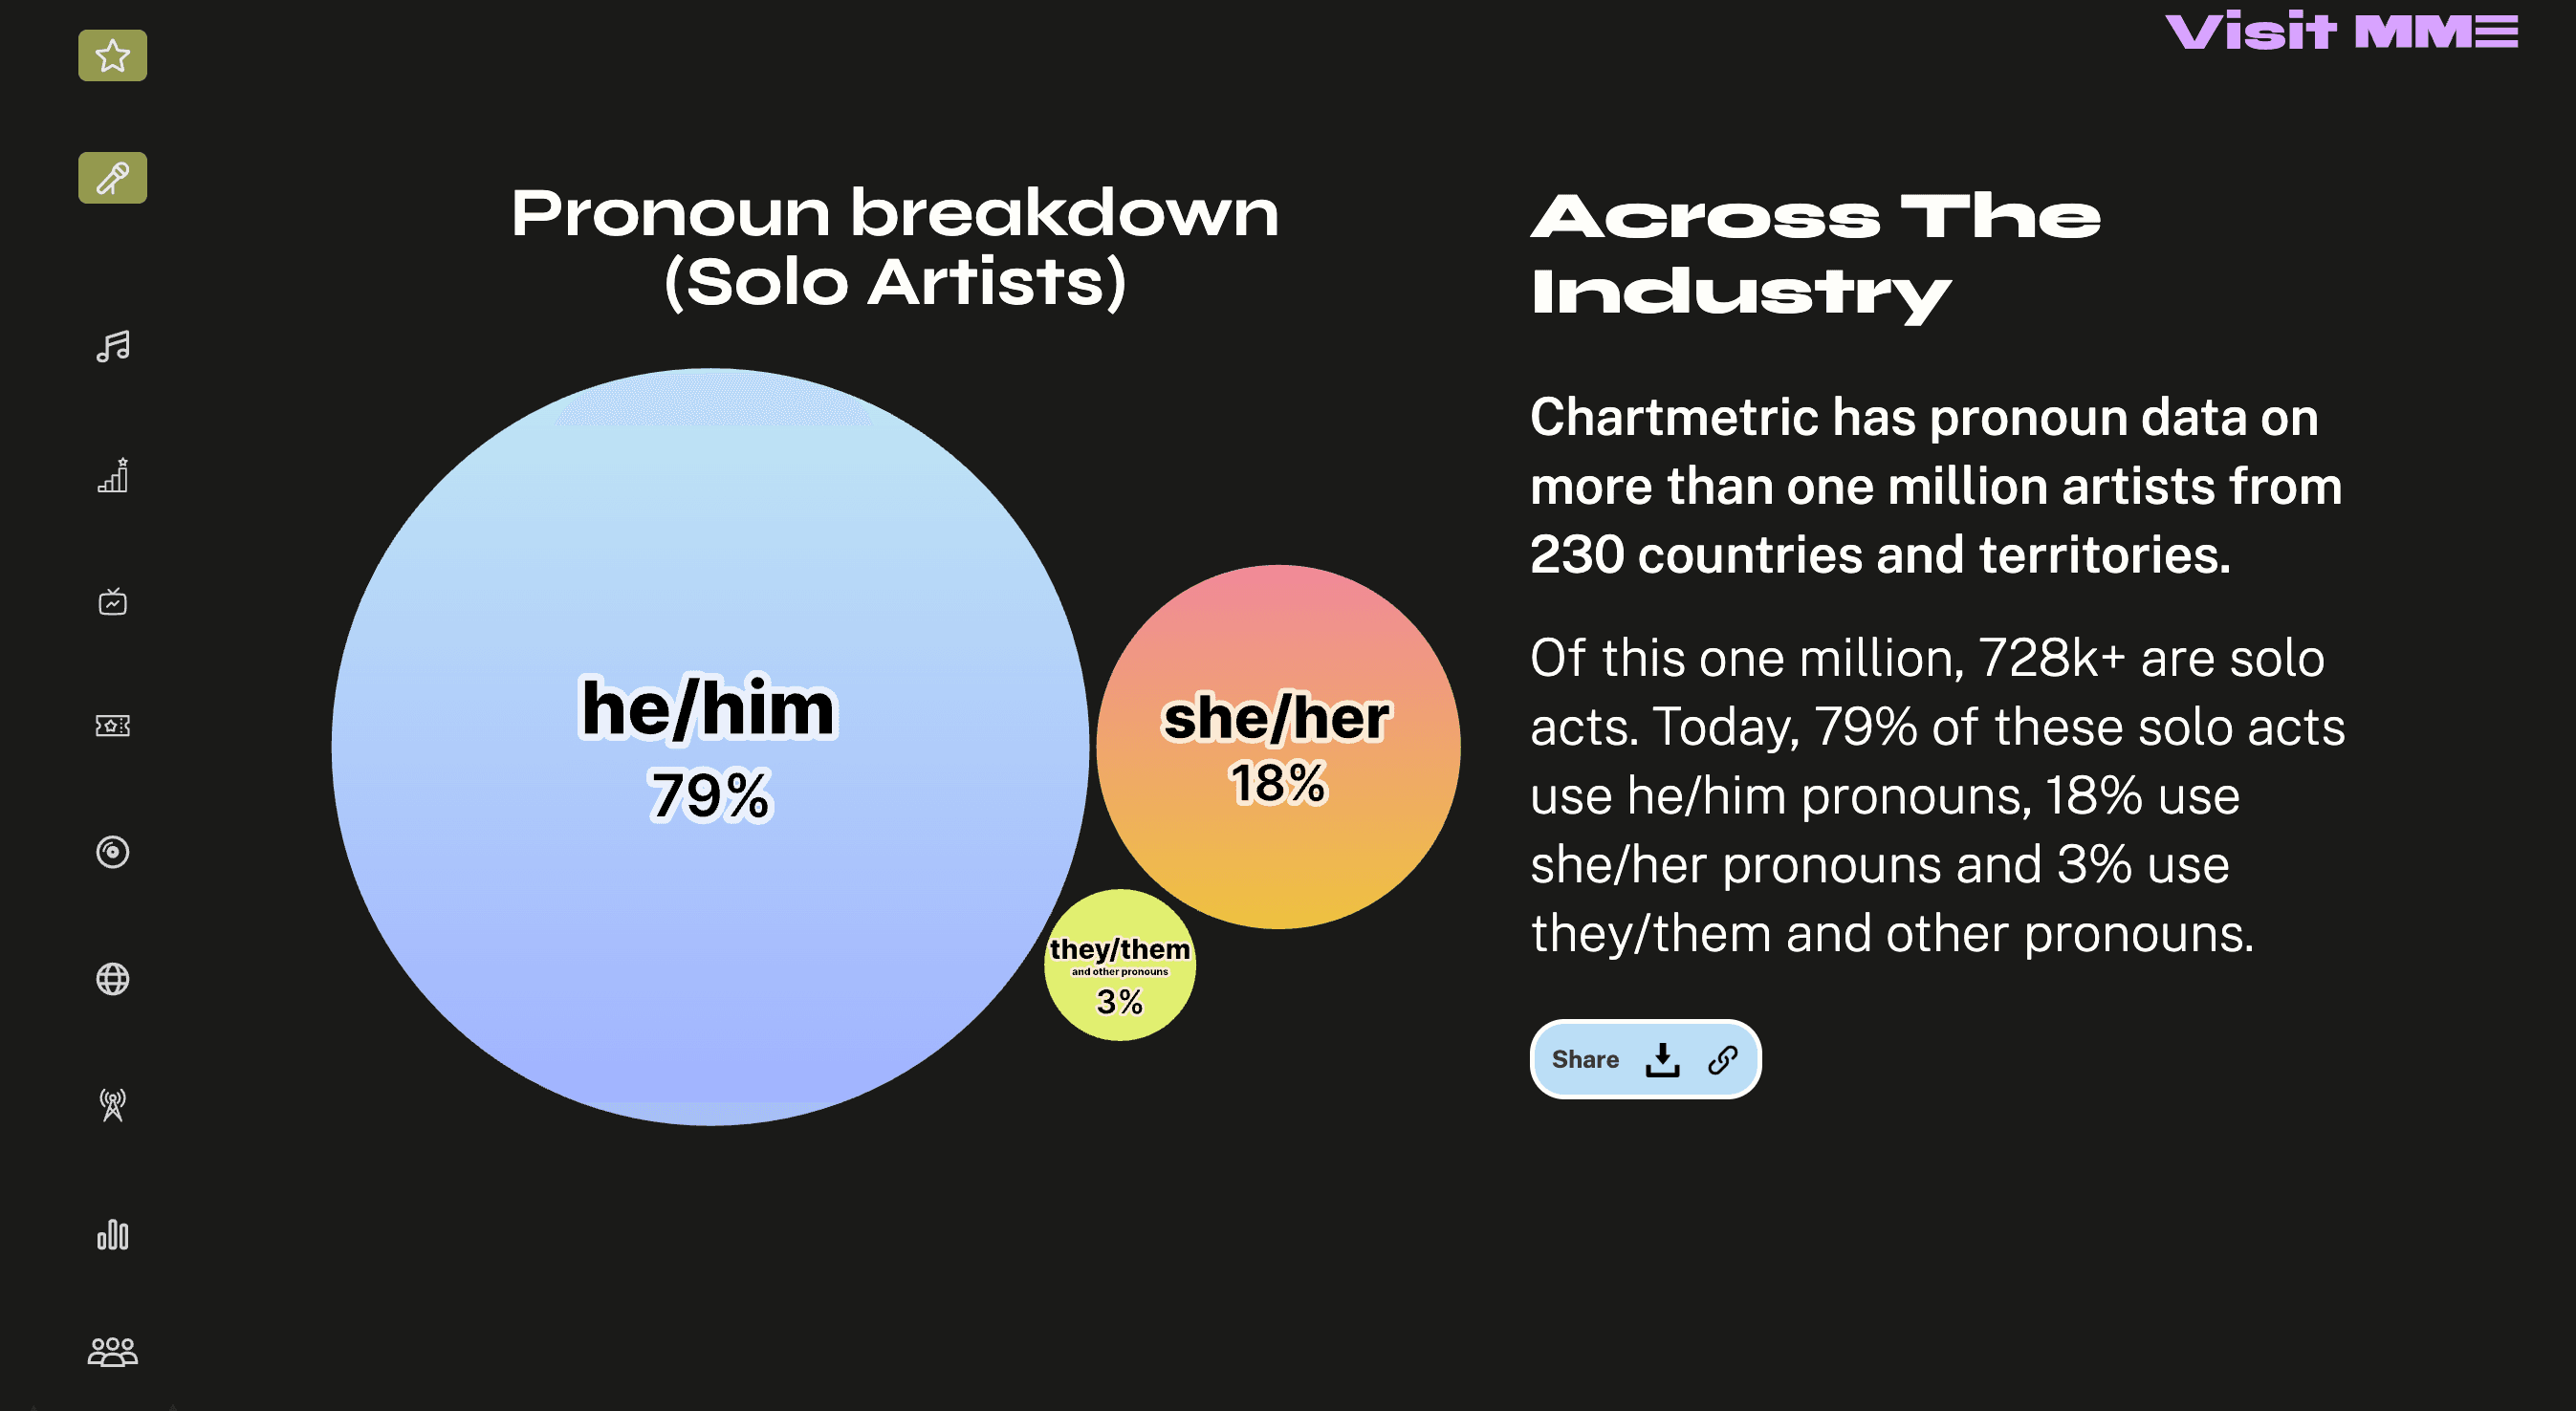
Make Music Equal

Year in Music
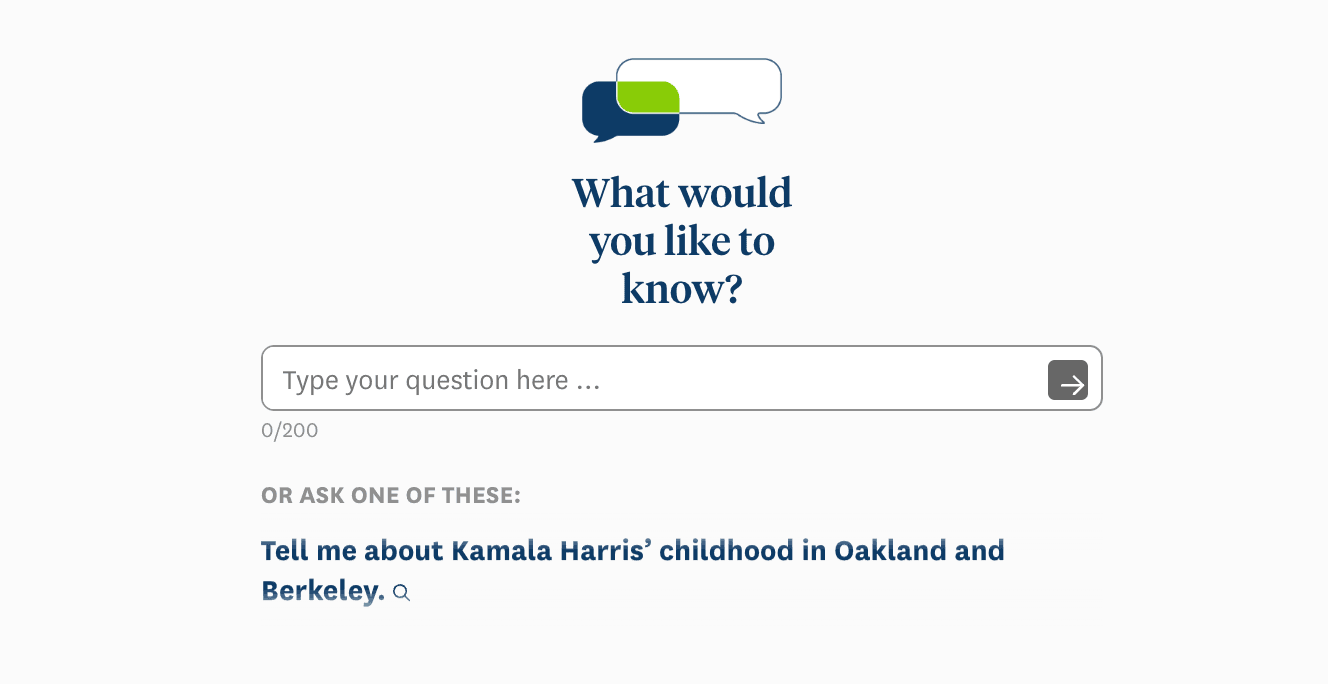
Kamala Harris News Assistant
SND award — experimental product and platform design
How have Bay Area home prices changed in your neighborhood?
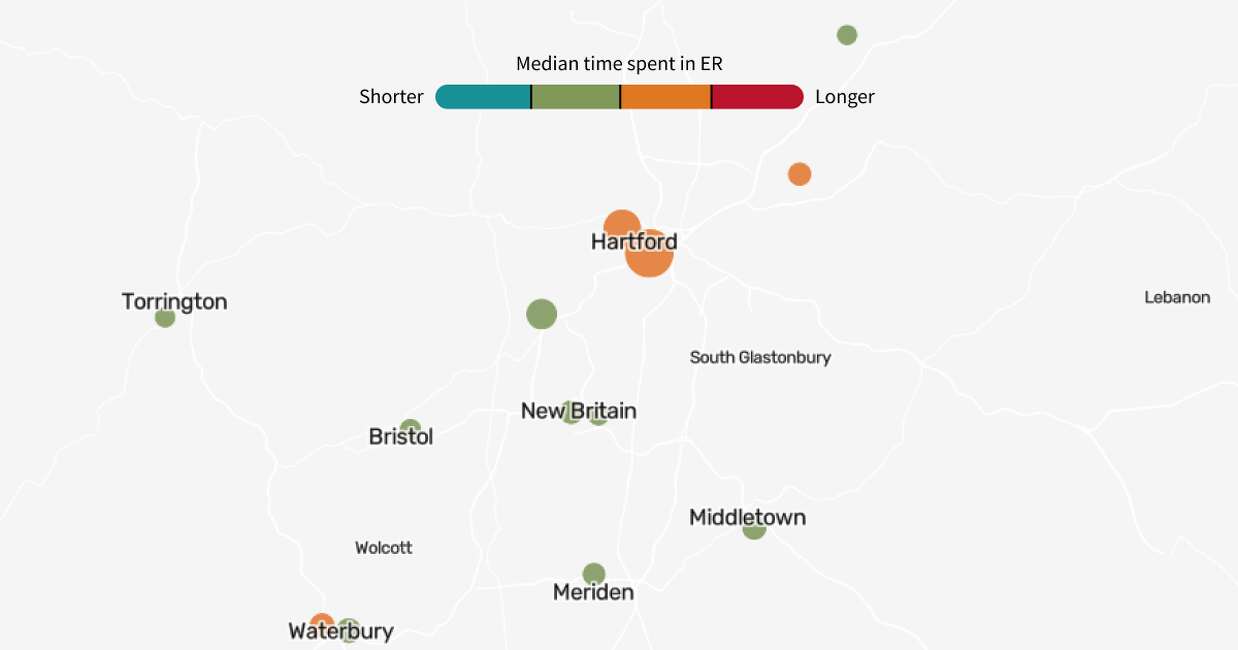
How long does an ER visit take at hospitals near you?
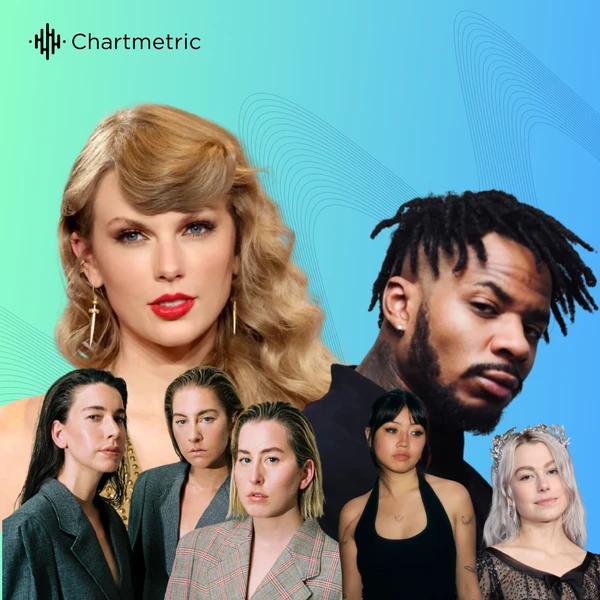
Exploring Taylor Swift’s Opening Acts Through the Years
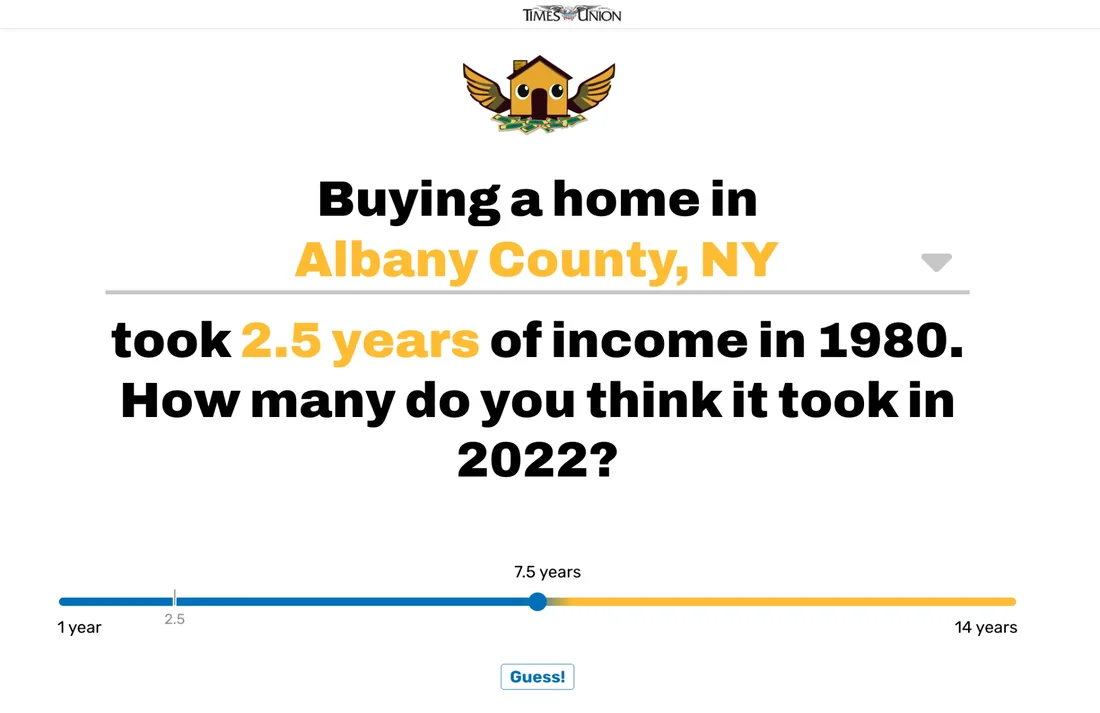
Buying a home in Albany County: How many years of income did it take in 2022?

What's in Your Wallet?
Information is Beautiful Awards 2022 — longlistOf Prose and Code
I love making data accessible to non-technical people, which drew me to making social media content around data art, history, and visualization design practices.
The archive
Articles and interactives in one drawer. Browse them by topic.
- How Music Charts · 2024
The Spread of Afrobeats into Latin America
(opens in a new tab) - How Music Charts · 2024
Drive to the Charts: Formula 1's Increasing Influence on the Music Industry
(opens in a new tab) - Latina · 2023
For This Famed Peruvian Restaurant, L.A. Is Just The Beginning
(opens in a new tab) - How Music Charts · 2023
Level Up Your Playlist: The Growing Popularity of Video Game Music
(opens in a new tab) - Latina · 2023
Along a Deadly Journey, These Mexican Women Give Hope to U.S.-Bound Migrants
(opens in a new tab) - How Music Charts · 2023
Karol G and the Latinas Taking Over Music Charts: A Look at Their Rise to Stardom
(opens in a new tab) - How Music Charts · 2023
Meet the Hispanic Artists Finding Success in India
(opens in a new tab) - How Music Charts · 2023
Heartbreak Music is Having a Self-Empowering Moment
(opens in a new tab)
About me
I studied journalism and sociology at NYU and now work with the Google Trends team analyzing what people are searching for worldwide. On my socials @ofproseandcode (opens in a new tab), I make videos about data outside the spreadsheets.
Born and raised in Lima, Peru, I’ve lived in New York, Shanghai, and LA before calling San Francisco home. Bilingual in English and Spanish, I love working on multilingual projects centering Latin America and diverse communities.
In my free time, you can find me running, watching Formula 1, or learning a new language (currently Portuguese). Always happy to chat and open to collaborating on data-driven editorial projects.